


Liberal Benefits, Conservative Spending
Reprinted from JAMA. The Journal of the American Medical Association May 15, 1991, Volume 265 Copyright 1991, American Medical Association
From Physicians for a National Health Program, Cambridge, Mass (Drs Grumbach, Bodenheimer, Himmelstein, and Woolhandler); the Institute for Health Policy Studies (Dr Grumbach) and the Department of Family and Community Medicine, University of California, San Francisco (Drs Grumbach and Bodenheimer); the Department of Medicine, the Cambridge (Mass) Hospital and Harvard Medical School (Drs Himmelstein and Woolhandler); and the Public Citizen Health Research Group, Washington, DC (Dr Himmelstein) Dr Grumbach is a Pew Health Policy Fellow.
Reprint requests to Physicians for a National Health Program, 1493 Cambridge St, Cambridge, MA 02139 (Dr Grumbach)
The Physicians for a National Health Program proposes to cover all Americans under a single, comprehensive public insurance program without copayments or deductibles and with free choice of provider. Such a national health program could reap tens of billions of dollars in administrative savings in the initial years, enough to fund generous increases in health care services not only for the uninsured, but for the underinsured as well. We delineate a transitional national health program budget that would hold overall health spending at current levels while accommodating increases in hospital and physician utilization. Future national health program spending would be indexed to the growth in gross national product adjusted for demographic, epidemiologic, and technologic shifts. Financing for the national health program would transfer funds into the public program without disrupting the general pattern of current revenue sources. We suggest a funding package that would augment existing government health spending with earmarked health care taxes. Because these new taxes would replace employer-employee insurance premiums and substantial portions of current out-of-pocket expenditures, they would not increase health costs for the average American.
THE AMERICAN approach to financing health care has gone awry. From physicians to patients, from The Heritage Foundation to the AFL-CIO, there is agreement that the system needs reform. But what kind of reform? Although all concur that the system is ailing, proposals diverge in their therapeutic approach. Many advocate adjustments of familiar regimens: larger doses of employment-based insurance and greater infusions of public funds to expand Medicaid or to subsidize risk pools for the uninsured.1-4 Because such measures do not confront the interdependent problems of rising costs and declining access, they cannot ensure health services to all at a cost the nation can afford. A lasting remedy requires basic restructuring of the way we pay for care.5, 6
The Physicians for a National Health Program plan would cover all Americans under a publicly administered, tax-financed national health program (NHP). A single public payer would replace the present array of more than 1500 private insurers, Medicaid, and Medicare. A unitary program could initially pay for expanded care out of administrative savings without adding new costs to the overall health care budget and would establish effective mechanisms for long-term cost control. Although consolidation of purchasing power in a public agency may cause apprehension among some physicians, the program could free them from the myriad administrative intrusions that currently plague the practice of medicine.
STRUCTURE OF THE NHP
We have previously described the design of the NHP in some detail.7, 8 It would create a single insurer in each state, locally controlled but subject to stringent national standards. States could experiment with the precise structure of the single insurer. Some may place it within a government agency, while others may choose a commission elected by the citizens or appointed by provider and consumer interests.
Everyone would be fully insured for all medically necessary services including prescription drugs and long-term care. Private insurance duplicating NHP coverage would be proscribed, as would patient copayments and deductibles. Physicians and hospitals would not bill patients directly for covered services. Hospitals, nursing homes, and clinics would receive a global budget to cover operating expenses, annually negotiated with the state health plan - based on past expenditures, previous financial and clinical performance, projected changes in cost and use, and proposed new and innovative programs. Itemized patient-specific hospital bills would become an extinct species. No part of the operating budget could be diverted for hospital expansion, profit, marketing, or major capital acquisitions. Capital expenditures approved by a local planning process would be funded through appropriations distinct from operating budgets.
Fee-for-service practitioners would submit all claims to the state health plan. Physician representatives (probably state medical societies) and state plans would negotiate a fee schedule for physician services. The effort and expense of billing would be trivial: stamp the patient's NHP card on a billing form, check a diagnosis and procedure code, send in all bills once a week, and receive full payment for virtually all services - with an extra payment for any bill not paid within 30 days. Gone would be the massive accounts receivables and the elaborate billing apparatus that now beleaguer private physicians. Alternatively, physicians could elect to work on a salaried basis for globally budgeted hospitals or clinics, or in health maintenance organizations capitated for all nonhospital services.
COSTS OF THE NHP
To estimate total costs, we start by using the Health Care Financing Administration's projection of 1991 costs under current policies as our "baseline" figure. The Health Care Financing Administration estimates that $567 billion will be spent on personal health care services and products in 1991, excluding nursing home costs and insurance overhead and profits (Table 1).9 (Although long-term care is covered by the NHP, we have omitted these costs to permit comparison with other acute care proposals.)
Universal coverage should increase the use of health services by the uninsured. According to the Lewin/ICF Health Benefits Simulation Model, approximately $36 billion of the $567 billion in 1991 spending projected under current policies will be accounted for by care for the uninsured, including free care at public hospitals, uncompensated care at private facilities cross-subsidized by insurance revenues, and services purchased out-of-pocket. The Lewin/ICF model estimates that an additional $12.2 billion would be required to increase the utilization by the uninsured to levels commensurate with those of the insured (Needleman et al10 and J. Sheils, oral communication, October 1990).
The NHP will not only assist the uninsured, but will also cover services (eg, preventive) and payments (eg, deductibles) that many insurers currently exclude. Would this more extensive coverage "induce" a surge of utilization among those currently insured? The RAND Health Insurance Experiment found that costs for persons assigned to a plan with no cost sharing were approximately 15% higher than the age-adjusted, per capita health care expenditures for the United States as a whole." However, a more natural experiment, a study before and after the implementation of an NHP in Quebec, failed to detect the overall utilization surge predicted by the RAND experiment.12, 13 Although the use of physician services in Quebec rose among those with lower incomes, the increase was counterbalanced by a decrease in utilization among the affluent. The net effect was convergence of utilization rates (adjusted for health status) among income groups, with no change in the overall rate.
Would an across-the-board increase in utilization be desirable? In the RAND experiment, lower-income patients with medical problems who received free care had better outcomes than those in cost-sharing plans.14 At the same time, many medical services currently provided are of no or of extremely marginal benefit,15-17 and it is not the intent of the NHP to inject an additional bolus of such unnecessary care into the health care system.
All these factors make it difficult to predict the level of overall utilization that would result from the NHP. For this analysis, we have added on the full $12.2 billion cost of bringing utilization rates of the uninsured up to those of the insured. We will discuss in the "Budgeting Under the NHP" section below how the NHP budget could also accommodate increases in utilization among the currently insured.
Savings of the NHP
The administrative efficiencies of a single-payer NHP offer the opportunity for large savings during the implementation of the program.18 Providers would be relieved of much of the expense of screening for eligibility, preparing detailed bills for multiple payers, responding to cumbersome utilization review procedures, and marketing their services. In 1987, California hospitals devoted 20.2% of revenues to administrative functions,19 in contrast to 9.0% spent by Canadian hospitals (L. Raymer, Health and Welfare Canada, written communication, April 1990). (These figures exclude malpractice premium costs and administrative personnel in clinical departments such as nursing.) The 11.2% difference is attributable to Canada's simplified hospital payment method, a method we propose for the United States.
Table 1 - Personal Health Care Costs for 1991, Excluding Nursing Home Care, With and Without a National Health Program (NHP), in Billions of Dollars*
| NHP | Current Policies | |
|---|---|---|
| "Baseline" conditions | 567 | 567 |
| New costs for previously uninsured | 12 | - |
| Discount for 11.2% hospital administrative savings | (31) | - |
| Discount for 6.25% physician administrative savings | (9) | - |
| Subtotal: Personal Health Care | 539 | 567 |
| Insurance administration and profits | 8** | 35*** |
| Total Personal Health Care Plus Insurance Overhead | 547 | 602 |
*This assumes Canadian-Ievel administrative efficiency
and changes in utilization only among the previously uninsured.
**1.4% of personal health care expenditures.
***This is the amount estimated by the Health Care Financing Administration.9
Determining the potential administrative savings in physician expenditures is more difficult. Although practice expenses are 49% of physician gross income in the United States and only 36% in Canada,20, 21 it is uncertain how much of this difference is due to billing costs. Malpractice costs for US physicians, for example, are higher than those in Canada. We therefore extrapolated billing cost data from a recent American Medical Association survey to project minimum expected administrative savings in physician expenditures.22 The average physician spent approximately $14500 in 1988 billing Medicare and Blue Shield alone, representing 5.5% of gross physician income. In addition, physicians spent approximately 2.75% of their own professional time on billing-related activities for these claims. (The survey did not measure the costs of billing other third parties or patients and therefore yields a low estimate of physician billing costs.) We liberally estimate that physician billing expenses in Canada are 1% of physician costs and that Canadian physicians spend at the most 1% of their time on billing (D. Peachey, MD, Ontario Medical Association, written communication, June 1990). In sum, US billing costs for physician time and practice expenses are at least 8.25% of total physician expenditures in contrast to at most 2% of Canadian physician costs. An NHP functioning at Canadian-level administrative efficiency could save at least 6.25% of physician costs. Most of these savings can be realized rapidly. In the private practice of one of the authors (T.B.), for example, the change to a single payer would allow an immediate reduction in office payroll of 18%.
Administrative savings to hospitals and physicians function as price discounts when calculating costs. For example, if physicians could lower their overhead by 6.25% of gross income by trimming billing expenses, fees could be lowered by 6.25% and physicians would still earn the same net income for the same volume of services. We therefore estimated the minimum potential administrative savings in hospital and physician expenditures to be $40 billion by discounting projected hospital and physician costs by 11.2% and 6.25%, respectively (Table 1).
Additional savings accrue from the reduced administrative "load factor" of a public plan. In 1987, the cost of public and private insurance overhead and profits expressed as a percent of personal health care expenditures was 5.9% in the United States and only 1.4% in Canada.9, 23 If our NHP operated with the efficiency of Canada's, the administration of health insurance would cost $8 billion, less than one quarter the $35 billion projected by the Health Care Financing Administration in 1991.
As indicated in Table 1, the net cost of personal health care and insurance overhead for universal coverage under the NHP, including expanded services for the previously uninsured, would be at most $547 billion if the system operated with the administrative efficiency of the Canadian system. This is $55 billion less than the $602 billion that will be spent in 1991 under current policies that exclude approximately 35 million Americans.
Budgeting Under the NHP
We do not propose reducing the health care budget by $55 billion under the NHP. As noted above, we are uncertain how utilization patterns might respond to universal, first-dollar insurance coverage. Nor can we be completely confident that hospitals and physicians will immediately shed their excess administrative poundage and assume the leaner proportions possible under a simplified payment system. We therefore propose the following budgetary strategy for the NHP: We would set the overall health care budget for the NHP's initial year at the amount projected under current policies ($602 billion if implemented in 1991). To keep expenditures within this target, we would rely on the ability of a single payer to allocate and enforce prospective budgets for physician and hospital services. These budgets would challenge providers to extract administrative savings and redirect resources into patient care for the underserved. The budget would allow a range of utilization responses among patients and physicians.
For example, the NHP could set total hospital operating budgets at the Health Care Financing Administration projected "baseline" 1991 level of $273 billion (Table 2), though some individual hospitals' budgets might be adjusted to reflect past underfunding or large operating surpluses. On average, a hospital able to achieve full administrative savings would have 11.2% of its budget to devote to more or better clinical services. Billing personnel could be transferred to clinical departments to perform clerical duties, freeing up nurses for bedside care. Hospitals unable to realize immediate administrative savings would not be penalized in the short run. However, in the longer run, the single payer within each state would evaluate hospitals' clinical performance and efficiency and modify budgets, taking account of these hospital quality measures as well as community needs. The Canadian experience demonstrates that such a budgeting process need not be cumbersome or expensive, consuming less than $2 per capita in British Columbia (D. Cunningham, British Columbia Ministry of Health, written communication, July 1990).
Prospective budgeting of physician services under fee-for-service methods would require expenditure targets or caps. On average, fees would be set at 6.25% below current levels, reflecting expected administrative savings to physicians. The expenditure target, however, could be set at $154 billion, 6% above the "baseline" projected level for 1991 (Table 2). This would allow physician payments to accommodate a net utilization increase of up to 12.25%, sufficient to satisfy increased demand by the uninsured and underinsured, while allowing a net increase in physician income of 6%. A utilization increase above 12.25% would trigger a compensatory decrease in fees to keep expenditures within the budget target. Such a plan allows for control of costs with a minimum of the administrative waste or encumbrances of our current utilization review mechanisms.24
Summing the aggregate hospital operating budget of $273 billion, the physician budget of $154 billion, and the other categories of personal health care spending and administration would still leave total expenditures $18 billion below our proposed $602 billion budget (Table 2). The $18 billion balance could be used for start-up costs for the NHP, job training and placement programs for displaced administrative personnel, improved long-term care, and revitalized public health programs.
Table 2 - National Health Program (NHP) Budget, by Category of Expenditure, in Billions of Dollars
| Category | NHP | Current Policies* |
|---|---|---|
|
Hospital |
273 | 273 |
|
Physician |
154 | 145 |
|
Other** |
149 | 149 |
|
Insurance administration and profits |
8 | 35 |
|
Subtotal |
584 | 602 |
|
New health initiatives and transition costs |
18 | 0 |
|
Total Budget |
602 | 602 |
*These are Health Care Financing Administration projections.9
**"Other" includes drugs, dental and other professional services, and so forth.
FINANCING THE NHP
Health insurance proposals are frequently shipwrecked on the shoals of their financing; any serious proposal must specify a revenue package. Although the NHP would not result in a net increase in total health care expenditures, it would produce a major shift in payment sources toward government and away from private insurance and out-of-pocket payments. We emphasize that the average individual and business would not pay more for health care under the NHP but would pay taxes that take the place of, but do not exceed, current premium payments and out-of- pocket costs. Moreover, with the single payer's capacity to control inflation, individuals and businesses should soon enjoy reductions in the rate of increase of their health care costs.
What principle should underlie the choice of revenue sources? Health care is only one factor - sometimes a minor one - in the promotion and preservation of health. Poverty, racial oppression, substance abuse, lack of education, lack of exercise, overnutrition and undernutrition, and occupational and environmental hazards all damage health. Some of these factors can be influenced by society's revenue-generating mechanisms. For example, raising excise taxes on cigarettes and alcohol reduces their consumption and thereby improves health, particularly among teenagers and the poor.25 On the other hand, burdening low-income families with high payments (whether taxes, premiums, or out-of-pocket dollars) reduces their disposable income and amplifies the ill effects of poverty. In contrast, a system of taxes and other payments that reduces the burden on low-income families without impeding job formation may ameliorate poverty's health consequences. Thus, funding mechanisms can be "healthy" or "unhealthy."
Table 3 - Public Plan's Share of 1991 Personal Health Care Expenditures Under National Health Program (NHP), in Billions of Dollars
| Service | Total Cost | % Covered by NHP | NHP Cost |
|---|---|---|---|
| Hospital | 273 | 96* | 262 |
| Physician | 154 | 91* | 140 |
| Other | 149 | 55** | 82 |
| New health initiatives and transition costs | 18 | 100 | 18 |
| Administration | 8 | 85** | 7 |
| Total | 602 | 85 | 509*** |
*These figures are based on the public share of spending for these services in Canada. The shares are less than 100% because certain services, such as cosmetic surgery, life insurance examinations, and private room surcharges, are not covered benefits.24 **These figures are based on our "best guess" estimate, since the NHP will provide more extensive coverage of nonhospital and nonphysician services than do the Canadian provincial plans. Nonprescription drugs are an example of a product in the "other" category that will not be covered.
***A total of $93 billion of personal health care expenditures uncovered by the NHP remain as out-of-pocket and individual private insurance premium costs.
Health care financing in the United States is markedly regressive and hence unhealthy. The bottom income decile receives 1.3% of total income but pays 3.9% of health costs, while the top income decile receives 33.8% of income and pays only 21.7% of health costs. By comparison, in Britain the bottom decile receives 2.3% of income and pays 1.7% of health costs, while the top decile receives 24.9% of income and pays 25.6% of costs.26 Any departure from the existing configuration of US health care funding should reverse the current unhealthy pattern.
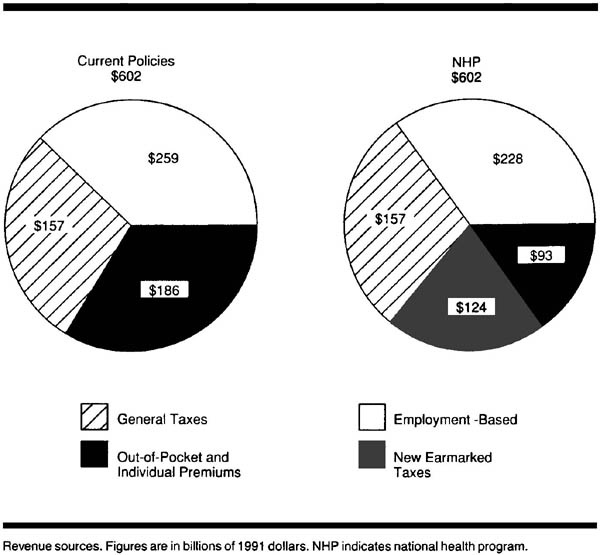
We estimate that public expenditures will account for 85% of health spending under the NHP, requiring $509 billion in revenues for 1991 (Table 3). We will discuss these revenues in three categories: (1) payroll taxes, (2) general government revenues, and (3) payments by individuals (Figure).
Payroll Taxes
Employer-employee payments for group health insurance (31% of personal health expenditures [excluding nursing-home care]27) are, in essence, a payroll tax,28 with the money going to an insurance company or a self-insured fund rather than to the government. Social Security payments for Medicare (12% of health expenditures27, 29) are also a payroll tax. It is logical to combine these two sources of financing, which together account for 43% of health expenditures. To minimize economic disruption, we propose that a similar proportion of the NHP be funded by payroll tax.
The regressive nature of a payroll tax makes it a less-than-healthy revenue source; the employer share is often shifted to employees as lower wages or to consumers as higher prices.30 It should be made more progressive by reducing the employee share for lower-wage employees, by raising the employee share for high-income employees (eg, eliminating the current Social Security cap), and by reducing the employer share for small business. Employers and employees currently pay almost 2% of total payroll for Medicare-related Social Security taxes and approximately 10% for private health insurance - a combined health-related payroll tax of 13%.29, 31, 32 Using Department of Commerce figures, we project that under the NHP, an average tax rate of 9% for medium and large employers, with an average 2% rate for employees, and half these rates for businesses with fewer than 20 employees, would raise $228 billion in revenues.33 These precise tax rates are only initial suggestions and must be negotiated with the affected parties.
General Government Revenues
Twenty-six percent of personal health expenditures (excluding nursing-home care) comes from non-Social Security governmental revenues at the federal, state, and locallevels.27, 29 Of this total, 51% comes from individual income taxes, 12% from property taxes, 12% from sales taxes, 12% from corporation income taxes, 5% from gasoline, tobacco, and alcohol taxes, and 8% from other sources.34 Although some of these revenue sources are unhealthy, we propose leaving them intact, adhering to the principle that implementing the NHP should not demand radical economic restructuring. These revenues would generate $157 billion for the NHP in 1991.9, 29
Payments by Individuals
The third major source of health financing consists of payments by individuals; these payments currently account for 31% of health expenditures (5% in individual insurance premiums, 24% in out-of-pocket payments, 1% in Medicare premiums, and 1% in other private funds).27, 29 They are the least healthy revenues because they burden lower-income families far more than they do the affluent. To the extent that they pay for services covered under the NHP, they will disappear.
We propose replacing the majority of individual payments with "healthier" revenues-taxes that reduce income disparities and discourage the use of harmful and polluting substances. The following measures, according to a Congressional Budget Office study,35 would generate $124 billion per year and could be considered as NHP tax revenue sources: (1) a new federal income tax bracket of 38% for families with income higher than $170, 000, (2) a cap on mortgage interest deductions for luxury homes, (3) a 0.5% tax on transfer of securities, (4) an increase in energy taxes to encourage energy conservation and reduce pollution, (5) an increase in excise taxes on cigarettes to 32 cents per pack and on alcohol to 25 cents per ounce, (6) an excise tax on sources of air and water pollutants, and (7) a tax on fossil fuels to reduce carbon dioxide emissions. Although some of these taxes are regressive, their overall effects are health promoting.
To summarize, the NHP would fund approximately 38% of health expenditures from a payroll tax similar to current payroll expenses for Medicare and health insurance premiums; 26% from existing federal, state, and local revenues; and 21% from new, healthy federal tax revenues that would largely supplant current out-of-pocket expenditures. Fifteen percent of expenditures would remain out-of-pocket (Figure).
A majority of Americans would accept this type of tax package if it were earmarked for health care and placed in a health care trust fund. A 1990 poll found that 72% would support an NHP even if it required a tax increase; however, only 22% would pay more than $200 extra per year.36 Our proposal would not increase the sums paid for health care by low- and middle-income groups. It is designed to minimize winners and losers, aside from the private health insurance industry.
Two additional principles should be incorporated in NHP funding. Per capita health spending should be equalized throughout the nation, with federal funds transferred to states under formulas adjusted for age, income levels, health status, wage, and other input costs. Finally, to protect the NHP from annual budgetary debacles in Washington, DC, it must be an entitlement program with a statutory expenditure floor as well as a ceiling. In contrast to entitlement programs restricted to poor families, the NHP would embrace the entire population and could thus command the level of support enjoyed by Social Security. Adequate increases in NHP funding (based on such factors as aging of the population, epidemics, advances in medical technology, and inflation) must be mandated by law. As suggested in our original NHP proposal,7 an expanded program of technology assessment would help guide budgetary allocations.
COMMENT
In health insurance, as in many things in life, simplicity is a virtue. The NHP's approach to universal access is simple: every American automatically qualifies for equal, comprehensive health insurance under a unitary public plan. The economic premises of the NHP are also simple: funnel all third-party payments through a single payer, thereby saving billions of dollars in administrative costs and achieving cost containment through global controls rather than minute bureaucratic scrutiny.
The administrative cost reductions during the NHP's initial phase are not, as some have argued, only a one-time saving.37 Whether in Canada or New Zealand, Sweden or Britain, single-payer systems have stabilized costs in the past decade, while US health care inflation has been impervious to the most earnest attempts to control costs.38-40 Economist Robert Evans41 has concluded that "universality of coverage and sole-source funding are, as far as we know now, preconditions for cost control."
Global expenditure control can also enhance clinical freedom. Under the micromanagement model of cost containment, each of the multiple payers, lacking global budgetary levers, resorts to intrusive patient-by-patient utilization review.24 Such day-to-day interference in medical practice is minimized in single-payer systems.40 As John Wennberg16 recently observed:
The key to the preservation of fee-for-service markets, as the Canadians seem to recognize, is not the micromanagement of the doctor-patient relationship but the management of capacity and budget. The American problem is to find the will to set the supply thermostat somewhere within reason.
The NHP would benefit most Americans, though a few powerful interest groups would suffer. It would virtually eliminate financial barriers to care for those who are currently uninsured and underinsured, ensure patients a free choice of providers, ensure physicians a free choice of practice settings, diminish bureaucratic interference in clinical decision making, stabilize health spending, and reduce the growing burden of health care costs for many individuals and employers. Small-business owners who do not currently cover their employees would face modest cost increases, though far less than mandated by most alternative proposals. The health insurance industry would feel the greatest impact. Indeed, most of the extra funds needed to expand care would come from eliminating the overhead and profits of insurance companies and from abolishing the billing apparatus necessary to apportion costs among the various plans. Job retraining programs for displaced administrative and clerical personnel would be essential.
Although few dispute the ability of the NHP to provide universal coverage and control costs, critics have raised the specter of rationing, pointing to queues for some high technology services in Canada.42 We do not advocate cutting US health spending to Canadian levels. Even with a slower rate of growth under the NHP, US health expenditures will remain well above those of any other nation. Deploying our greater resources with Canadian efficiency would permit increases in utilization and improvements in technology without skyrocketing costs. Compared with Americans, Canadians do, in fact, get more health care for their health care dollar. About half of the cost differential between the two nations is squandered on insurance overhead and paper pushing.18, 43 Stanford economist Victor Fuchs44 has concluded that "the quantity of [physician] services per capita is much higher in Canada than in the United States . . . the data firmly reject the view that Canadians save money by delivering fewer services."
Health financing reforms unable to extract administrative savings inevitably impose added costs for expanded services. Employer mandate proposals (eg, the Pepper Commission Plan,1 the American Medical Association's Health Access America plan,3 the National Leadership Commission's proposal,2 and Massachusetts' Universal Health Care Law [New York Times. April 11, 1991:Al]) would leave existing insurance in place while expanding public programs for the unemployed and requiring employers to insure their workers. None of these plans offer improved coverage for those currently insured, nor do they offer new cost control mechanisms. Hence high initial costs presage continuing inflation or far more stringent and intrusive micromanagement - probably both. Modifications of the employer mandate approach (eg, the UNYCare proposal in New York State)45 that attempt to meld the cost containment features of a single-payer system with a continuing role for private insurance also eschew most administrative savings, compromising the ability of such measures to expand access without raising costs.
There is slim evidence that Enthoven and Kronick's46 "managed competition" plan - featuring competing managed care insurers and higher patient copayments - can hold costs in check.47 Does forcing consumers to bear premium costs for higher-priced plans hold down overall costs or simply segregate the market based on ability to pay? Do low-cost plans provide care more efficiently or simply market themselves more effectively to lower-risk subscribers? Is the rubric "Consumer Choice Health Plan" appropriate for a system likely to lock the vast majority of patients and physicians into closed panel health maintenance organizations run by insurance companies? The ultimate vision of managed competition - a landscape dominated by a limited number of huge health maintenance organizations managing salaried physicians-is a more radical departure from the current health care scene than the NHP.
The objectives of the NHP are simple: (1) to minimize financial barriers to appropriate medical care, (2) to distribute costs fairly, and (3) to contain costs at a reasonable level. Once a structure is in place for meeting these basic concerns, the medical profession and society as a whole can move on to the more complicated questions: Which health services truly improve the quality of life? What share of our human and material re sources should we devote to health care? How shall we reduce the toll now extracted by poverty, ignorance, and addictions? By implementing a national health program, we can turn and face the challenges ahead.
References
1. US Bipartisan Commission on Comprehensive Health Care. A Call for Action. Washington, DC: The Pepper Commission on Comprehensive Health Care; 1990.
2. National Leadership Commission on Health Care. For the Health of a Nation. Ann Arbor, Mich: Health Administration Press; 1989.
3. Health Access America. Chicago, Ill: American Medical Association; 1990.
4. Kennedy E. Senate Bill S.768. November 20, 1989.
5. Woolhandler S, Himmelstein DU. Resolving the cost/access conflict: the case for a national health program. J Gen Intern Med. 1989; 4: 54-60.
6. Grumbach K. National health insurance in America: can we practice with it? can we practice without it? West J Med. 1989; 151: 210-216.
7. Himmelstein DU, Woolhandler S. A national health program for the United States: a physicians' proposal. N Engl J Med. 1989; 320: 102-108.
8. Woolhandler S, Himmelstein DU. A national health program: a northern light at the end of the tunnel. JAMA.1989; 262: 2136-2137.
9. Health Care Financing Administration. National health expenditures: 1986-2000. Health Care Financing Rev. 1987; 8(4): 1-36.
10. Needleman J, Arnold J, Sheils J, Lewin LS. The Health Care Financing Systent and the Uninsured. Washington, DC: Lewin/lCF; 1990.
11. Newhouse JP, Manning WG, Morris CN, et al. Some interim results from a controlled trial of cost sharing in health insurance. N Eng J Med. 1981; 305: 1501-1507.
12. Enterline PE, Salter V, McDonald AD, McDonald JC. The distribution of medical services before and after 'free' medical care: the Quebec experience. N Engl J Med. 1973; 289: 1174-1178.
13. McDonald AD, McDonald JC, Salter V, Enterline P. Effects of Quebec Medicare on physician consultation for selected symptoms. N Engl J Med. 1974; 291: 649-652.
14. Brook RH, Ware JE Jr, Rogers WH, et al. Does free care improve adults' health? results from a randomized controlled trial. N Engl J Med. 1983; 309: 1426-1434.
15. Eisenberg JM. Doctors' Decisions and the Cost of Medical Care. Ann Arbor, Mich: Health Administration Press; 1986.
16. Wennberg J. Outcomes research, cost containment, and the fear of health care rationing. N Eng J Med. 1990; 323:1202-1204.
17. Chassin MR, Kosecoff J, Park RE, et al. Does inappropriate use explain geographic variations in the use of health care services? JAMA. 1987; 258: 2533-2537.
18. Himmelstein D, Woolhandler S. Cost without benefit: administrative waste in US health care. N Eng J Med. 1986; 314: 441-445.
19. Aggregate Hospital Financial Data for California: Report Periods Ending June 30, 1987-June 29, 1998. Sacramento: California Health Facilities Commission; 1989.
20. Gonzalez ML, Emmons DW. Socioeconomic Characteristics of Medical Practice. Chicago, Ill: American Medical Association; 1988.
21. Iglehart J. Canada's health system faces its problems. N Eng J Med. 1990; 322: 562-568.
22. American Medical Association. The administrative burden of health insurance on physicians. Socioeconomic Monitoring Survey Rep. 1989; 3: 2-4.
23. National Health Expenditures. Ottawa, Ontario: Health and Welfare Canada; 1990.
24. Grumbach K, Bodenheimer T. Reins or fences? a physician's view of cost containment. Health Aff 1990; 9(4):120-126.
25. Last JM. Controlling the smoking epidemic. Am J Prev Med. 1985; 1: 1-3.
26. Wagstaff A, Van Doorslaer E, Paci P. Equity in the finance and delivery of health care: some tentative cross-country comparisons. Oxford Rev Econ Policy. 1989; 5: 89-112.
27. Levit KR, Freeland MS, Waldo DR. National health care spending trends: 1988. Health Aff 1990; 9(2):171-184.
28. Reinhardt UE. Health insurance for the nation's poor. HealthAff 1987; 6(1):101-112.
29. Levit KR, Freeland MS, Waldo DR. Health spending and ability to pay: business, individuals, and government. Health Care Financing Rev. 1989; 10(3):1-11.
30. Pechman JA. Federal Tax Policy. Washington, DC: The Brookings Institution; 1987.
31. Bergthold LA. Purchasing Power in Health. New Brunswick, NJ: Rutgers University Press; 1990.
32. DiCarlo S, Gabel J. Conventional health insurance: a decade later. Health Care Financing Rev. 1989; 10(3):77-89.
33. Bureau of the Census. Statistical abstract of the United States 1990. Washington, DC: US Dept of Commerce; 1990.
34. Bureau of the Census. Quarterly Summary of Federal. State. and Local Tax Revenue. July-September 1989. Washington. DC: US Dept of Commerce; 1990.
35. Congressional Budget Office. Reducing the Deficit: Spending and Revenue Options. Washington. DC: The Congress of the United States; 1990.
36. Blendon RJ. Donelan K. The public and the emerging debate over national health insurance. N Engl J Med. 1990; 323: 208-212.
37. Aaron H. Schwartz WG. Rationing health care: the choice before us. Science. 1990; 247: 418-422.
38. International comparisons of health care financing and delivery: data and perspectives. Health Care Financing Rev. 1989; 10 (suppl): 1-196.
39. Pfaff M. Differences in health care spending across countries: statistical evidence. J Health Polit Policy Law. 1990; 15: 1-24.
40. Evans RG. Lomas J. Barer ML. et al. Controlling health expenditures: the Canadian reality. N Eng J Med.1989; 320: 571-577.
41. Evans RG. Accessible, acceptable, and affordable: financing health care in Canada. In: The 1990 Richard and Hinda Rosenthal Lectures. Washington. DC: Institute of Medicine; 1990:7-47.
42. Board of Trustees. American Medical Association. Study of the Canadian Health Care System. Chicago. Ill: American Medical Association; 1989. Report V(A-89).
43. Evans RG. Split vision: interpreting cross-border differences in health spending. Health Aff 1988;7(4):17-24.
44. Fuchs VR. Hahn JS. How does Canada do it? a comparison of expenditures for physiciansŐ services in the United States and Canada. N Eng J Med. 1990; 323: 884-890.
45. Beauchamp DE. Rouse RL. Universal New York Health Care: a single-payer strategy linking cost control and universal access. N Engl J Med. 1990; 323: 640-644.
46. Enthoven A. Kronick R. A consumer choice health plan for the 1990s: universal health insurance in a system designed to promote quality and economy. N Engl J Med. 1989; 320: 29-37, 94-101.
47. Jones SB. Can multiple choice be managed to constrain health care costs? Health Aff 1989;8(3): 51-59.